Review of CAPM
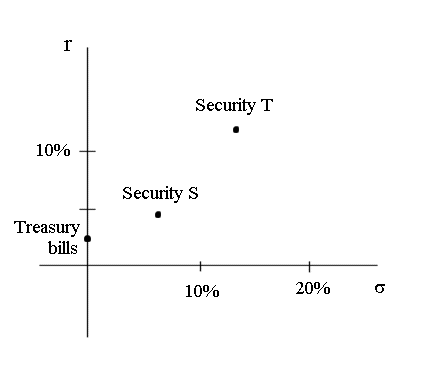
Risk return graph to position any security
- abscissa axis : sS
- ordinate axis : rS
-

CAPM theory identifies, for any security, a fundamental
risk and a specific risk (akin to an extra roulette wheel generated
randomness)
- fundamental risk (= market risk, = undiversifiable
risk, = systematic risk, = risk which cannot be eliminated) vs...
- ...specific risk (which can be eliminated by
averaging out in a portfolio of "similar" securities).
- It is a mathematical result in linear algebra of
RVs
- TB have zero risk, zero variability. Their return
is the minimum (average) return one can get in the market. And it is
sure.
CAPM main results
- One central portfolio is the "market portfolio",
denoted M
- M is well approximated by any well diversified
portfolio of 20 to 40 securities (eg : S&P portfolio, DJ portfolio)
- Define, for any security S sold in the market, bS = covariance(RS, RM)
/ Var(RM)
- It is approximated by the slope of the straight
line fitted, with the appropriate method, through a scattergram of past
outcomes of (RM, RS)
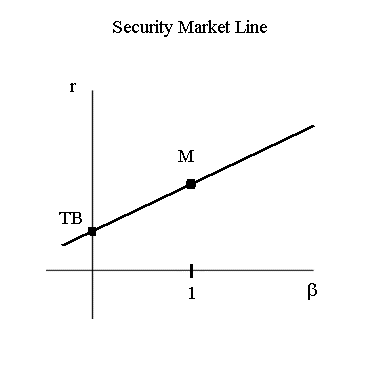
- RS = rTB + bS
(RM - rTB) + eS
- We say that S moves "like the market" with a
"reactivity factor" bS, plus an
extra random term eS the mean of
which is zero.
- Let's look at the expectation of RS (denoted
rS)
- rS = rTB + bS
(rM - rTB)
- Let's look at the variance of RS (denoted s2S)
- s2S
= b2S * s2M + Var(eS)
- The part b2S *
s2M
is called the undiversifiable risk of the security S
- A portfolio made of a few securities is also,
itself, a security
- A central idea of CAPM is to "average out" the
diversifiable part of the risk of securities of same b by pooling them into portfolios
- Remember, if you throw one die, you will get a
random result with mean 3,5 and std dev 1,7. If you throw several dice,
the average result won't change but the std dev of the average result
will be reduced.
- beta of any security S is estimated from past
history of S and M, and published by agencies like Merrill Lynch.
-


