Wednesday 3rd November 2004
Finance : Fourth lecture (part two).
Review session to ascertain the material learned so far (continued).
Exercise 1
Exercise 2
Exercise 3
A security S with E(X) = 6€ and std dev (X) = 1,333€
The price of S today
A security T with the
same risk pattern as S
Risk patterns do not refer to prices !
Computing the price we should offer for T
Opportunity cost of capital
Discounted Cash Flow analysis
Exercise 4
Here are 20 outcomes of a random variable which is the profitability of a security each year over a period of 20 years
| 0,46% |
| -4,67% |
| 4,53% |
| 7,40% |
| 13,73% |
| 11,05% |
| 4,13% |
| 15,97% |
| -2,06% |
| -3,92% |
| 3,15% |
| -12,54% |
| 5,00% |
| 13,79% |
| -1,40% |
| 4,61% |
| 5,00% |
| 6,05% |
| 30,23% |
| 19,52% |
Draw the plain plot of the data (Answer)
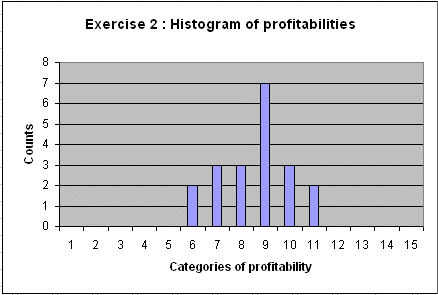
Draw the histogram of the data in exercise 1
Use the categories
category 1 : data ≤ -30%
category 2 : -30% < data ≤ -25%
category 3 : -25% < data
≤ -20%
...
category 13 : 25% < data
≤ 30%
category 14 : 30% < data
≤ 35%
category 15 : 35% < data
(Answer)
Drawing by hand, fit a bell shape curve on the histogram obtained in Exercise 2.
Then, reading from this bell shape curve, estimate the mean of the random variable, and estimate its standard deviation.
(Answer)
A security S with E(X) = 6€ and std dev (X) = 1,333€
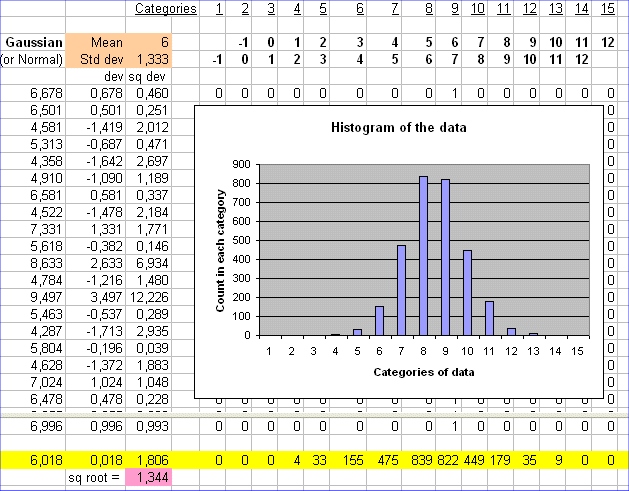
Think of a security S, that promises in one year a cash flow X, with mean 6€. And for some reason (past history, or some other source) we also know that the variability of X : the standard deviation of X is 1.333€
Note that we don't yet talk about the price PS today. Sometimes we will indeed consider securities for which there is no price yet (until we offer one ourself !).
Here is a picture of 3000 outcomes of X (the value of S in one year) :

To talk about the average profitability of this security S we have to think of its price PS today.
For example if PS = 5.7€ , the average profitability of S is (6-5.7)/5.7=5.26%
Caveat : often, in Finance, we talk about "the profitability of S" when we actually mean "the average profitability of S".
To talk about the actual profit we shall make next year, by buying S today, we have to know
PS and the actual value X will take next year.
If next year X takes the outcome 8€, and we paid for S 5.7€, we shall be very happy. We will make a profit of 2.3€, or equivalently a profit of 40.4%
But on average we know that next year's value will be 6€.
And therefore it would be silly to pay that much (that is 6€) for S today. (Well, my hand typed faster than my mind. In fact it is not silly. It cannot be demonstrated that it is silly. But what is sure is that it is a gambler's behavior. It is not the behavior of a risk averse person. And financial investors for the most part are risk averse people.)
Even if the future value of S was sure, with no variability, the max price we should be willing to pay today is 6/(1+2%) = 5.88€
As we just saw, to talk about the profitability of S, we need to know its price today.
Suppose the price of S today is PS = 5€
Fine. S will yield an average profit of 1€, with a variability of 1.333€ (measured by its standard deviation).
The average profitability of S is then
E(RS) = [ E(X) - 5 ] / 5 = 20%
More generally, we can write E(RS) = [ E(X) - PS ] / PS
And in fact, more simply, the random profitability in one year is
RS = [ X - PS ] / PS
Therefore, too, standard deviation of RS = standard deviation of X / PS
Notations :
the mean of RS is denoted rS
and the std dev of RS is denoted σS
Here rS = 20% and σS = 26.67%
A security T with the same risk pattern as S
Suppose that we are offered a security T for purchase. We are asked to make a bid.
In order to make a bid, we must know what we are buying, that is what will be the average value of T in one year, and what is the variability of this value in one year.
We are given this information :
T will have a value Y in one year. Y is a random variable (otherwise it would be a Treasury bond, and we know readily how much to offer for it).
We are told that E(Y)=180€, and std dev(Y)=40€
Here is a plot of 3000 possible outcomes of Y :
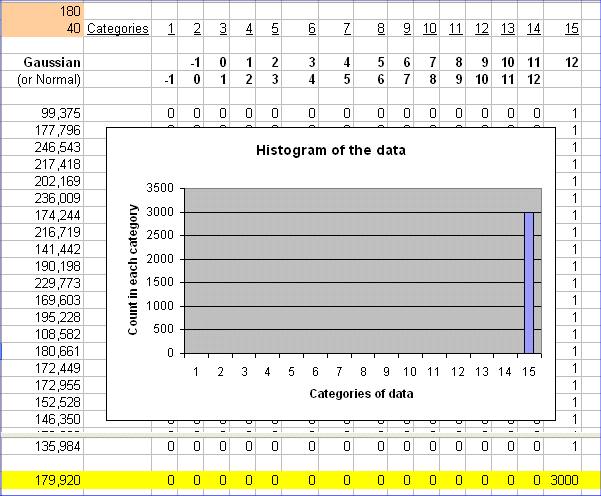
Oops ! The histogram does not tell us much !
That's because the categories to count the data are no longer adapted to drawing a histogram of the outcomes of T.
Let's adapt the categories :
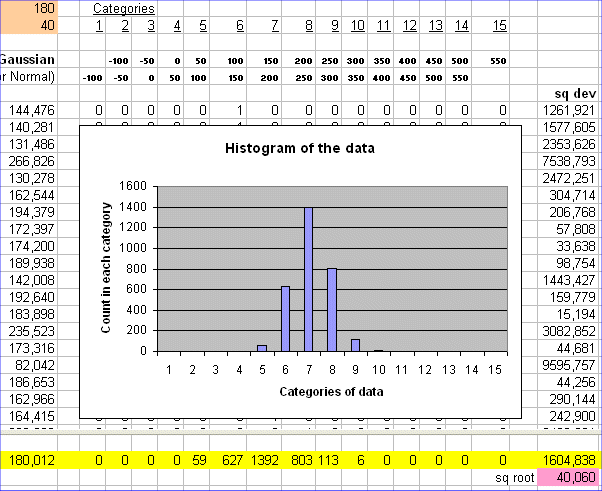
Even though this histogram does not exactly look like the histogram of the future values of S, S and T have the same risk pattern.
Indeed E(X)/sd(X) = E(Y)/sd(Y) = 4.5
The exact shape of the histogram of T depends upon the categories we chose to draw it (the boundary values, and the width of the slices).
So two securities can have the same risk pattern and their histograms not look exactly the same. What matters is whether E(X)/sd(X) = E(Y)/sd(Y) or not.
Risk patterns do not refer to prices :
Note that to establish that T has the same risk pattern as S, we do not need to know a price for T, nor for S for that matter.
All we need to verify is that E(X)/sd(X) = E(Y)/sd(Y).
And in fact the next step is precisely to figure out what price we should offer for T !
Computing the price we should offer for T :
What price should we offer for T ?
In order to solve this problem we have three important pieces of information :
These are the three pieces of information, and only three pieces of information, we need to compute a price for T.
Considering that for Finance people the risk of a security is the standard deviation of its profitability (here the risk of S is 26.67%), and that for two securities with the same risk they will require the same profitability (fundamental fact of Finance, restated), we are in a position to compute the price of T.
There is a little twist in the argument that will follow, because we cannot talk about the risk of T until we have a price for it.
Claim : the price of T should be PT = E(Y) / (1 + rS)
This yields PT = 180 / (1 + 20%) = 150€
A higher price for T would violate the fundamental principle of Finance. But to verify this the argument is in two steps.
First, let's consider a higher price say PT = 160€ for T.
Under this hypothesis the security T for us has an expected profitability
E(RT) = [ E(Y) - 160 ] / 160 = 12,5%
A priori, why not ? If the risk is also less than the risk of S...
And indeed std dev (RT) = std dev { [ E(Y) - 160 ] / 160 } = std dev(Y) / 160 = 40/160 = 25%
So it looks like such a price for T is OK : "if we pay 160€ for T, we have less average profitability than with S, but we also have less risk..."
But it is not OK. Here is the final stab in the speculation "what about paying PT = 160€ for T ?" :
If indeed we don't like a risk as high as 26.67% (the risk of S), and are ready to give up some profitability to have a lower risk, we can still do better than T.
Let's take our 160€ ; let's spend 150€ buying 30 S's ; and we just spare the extra 10€ (we keep them in our pocket).
This is like "investing 160€ in a security V".
What is the expected profitability of V ? Ans. : 30/160 = 18.75%
What is the risk of V ? That is what is the std dev of the profitability of V ?
Ans. : std dev [ (30*X - 160)/160 ] = (30/160) * std dev(X) = (30/160)*1.333 = 25%
So, if we don't want to go higher than 25% in terms of risk, we don't need to go as low as 12.5% in terms of profitability. We can have a risk of 25%, with a profitability of 18.75%
Conclusion : paying a price of 160€ today for T violates the fundamental principle of Finance. Because there is a better security (V), in terms of profitability, with the same risk.
So the price we should pay for T is
PT = E(value of T in one year) / (1 + rS)
This is called "discounting the future cash flow of T by the discounting factor rS"
rS is called the opportunity cost of capital of investing into T.
The opportunity cost of capital of a projected investment is the profitability of a security, traded on the market, which has the same risk pattern as the projected investment.
Discounted Cash Flow analysis :
Computing PT = E(Y)/(1 + rS) is the simplest kind of discounted cash flow analysis. We computed the price we are willing to pay today for T by discounting its future cash flow with its opportunity cost of capital.
DCF (Discounted Cash Flow) analysis will keep us busy for a few lectures.
We are offered today to make an investment into a security U, which will produce a random cash flow in one year. This random cash flow in one year is expected to have an average value of $1200. But we are not sure : there is a variability about it.
We also know that investing into U has the same risk pattern as investing into a security V, the profitability of which is 15%. That is the risk pattern of V is the same as the risk pattern of U.
Question : What maximum price should we accept to pay for U today ?
(Answer)
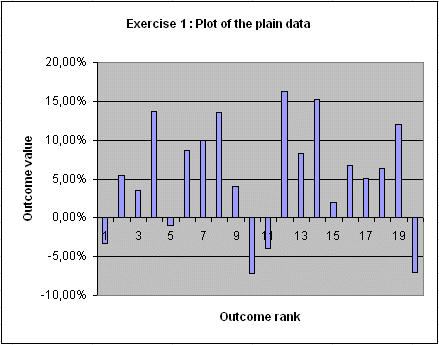
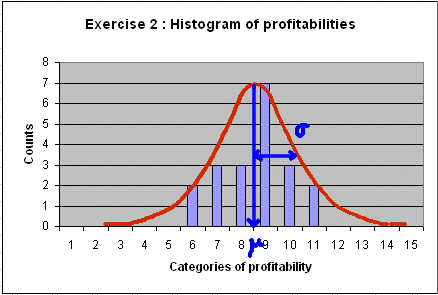
The mean falls between category 8 ( 0% < data ≤ 5% ) and category 9 (5% < data ≤ 10%). So the mean is around 5%.
The estimated standard deviation, read from the graph, is roughly the width of one and a half category, that is 7.5%
PU = 1200 / (1 + 15%) = $1043.5
Of course if we can pay less, it's fine.