Wednesday January 19th 2005
Finance : thirteenth lecture (part two)
Portfolios of securities and Capital Asset Pricing Model (CAPM)
Real data : Coca-Cola and Compaq stocks
Statistics about the two securities
A portfolio made of α Coca-Coca and (1 -
α) Compaq
Portfolios made of more than two securities
Portfolios including Treasury bonds
The market portfolio M
Coefficients
β's
Capital Asset Pricing Model
Conclusions on the CAPM
Obtained from Brealey & Myers textbook, we consider the series of values of the profitabilities of two securities, Coca-Cola and Compaq, over a period of time. The period of time is five years, from mid-1989 to mid-1994. (This is before Compaq merged with Hewlett-Packard.)
In order not to work with only 5 points representing yearly profitabilities, we shall work with the 60 monthly profitabilities (profitability from one month to the next) of these two securities. All the subsequent analysis of portfolio optimization will be performed to obtain an ideal portfolio in term of monthly profitability. The reasonings are exactly the same, irrespective of the period of time we use for our analysis of the future. (Just like in accounting the choice of the year as the accounting period is just a convenient convention. But Income statements and Balance sheets can be established on a monthly basis, if we like. In fact most large corporations publish accounting data on a quarterly basis.)
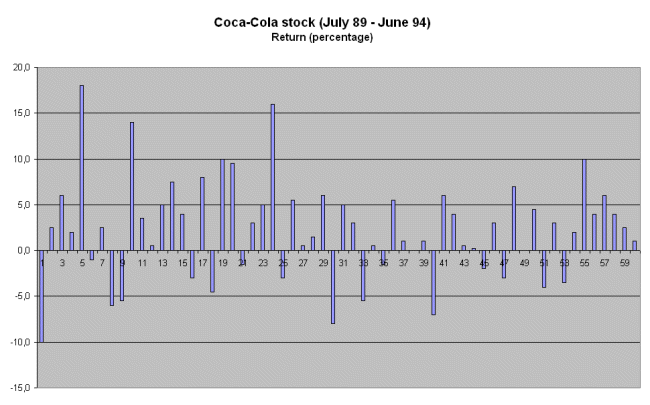
Here are the data on the securities, presented in a standard chronological way :
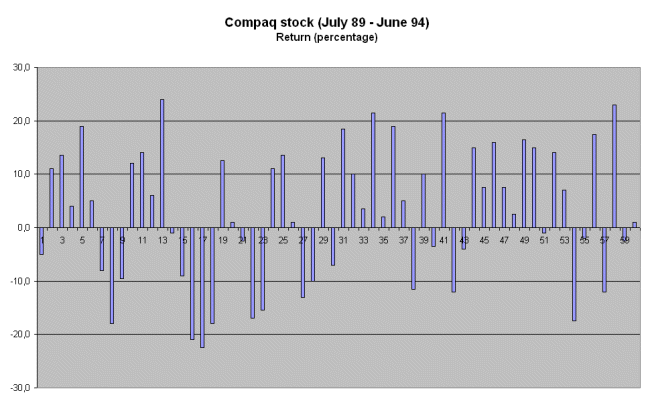
These are the usual data anyone can obtain from the stock market, by looking, from one month to the next, what the profitability was :
{ [new price + dividends (averaged on a monthly basis), if there were some] - old price } / old price
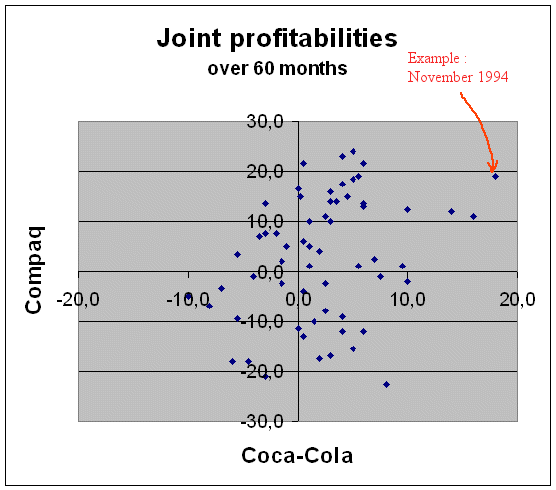
To these two series of profitabilities corresponds a scattergram of joint profitabilities :
Statistics about the two securities :
Taking into account that the scale on the ordinate axis is slightly more compressed than on the abscissa axis, we can read from the above scattergram that
Calculations yield :
E(profitability of Coca-Cola) = 2.25%
σ(profitability of Coca-Cola) = 5.48%, calculated with Excel.
(caveat : Excel uses a formula for the estimated variance, where it divides the sum of squared deviations by 59 instead of 60. For those familiar with statistics : the reason is that it makes the estimated variance unbiased. Don't worry about statistical fine tuning and use 60 when you do the calculations by hand.)
E(profitability of Compaq) = 2.85%
σ(profitability of Compaq) = 12.57%, calculated with Excel.
and finally
Correlation of Coca-Cola and Compaq = 31.2%
A portfolio made of α Coca-Coca and (1 - α) Compaq :
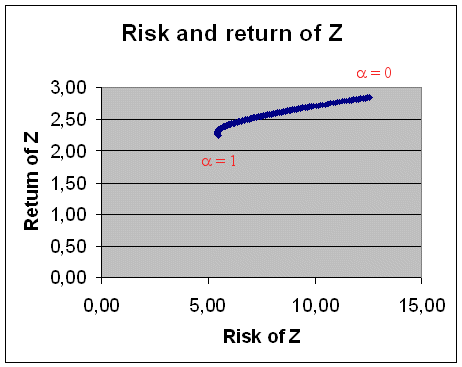
As we already did several times before, we now look at the profitability of a portfolio Z constructed as follows :
Z = α Coca-Cola + (1 - α) Compaq
and we look at E(Z) and σ(Z) for various values of α.
With α going from 1 (portfolio entirely made of Coca-Cola) to 0 (portfolio entirely made of Compaq) we get this curve :
Here is a magnified view of the interesting part, with α between 100% and 70% :
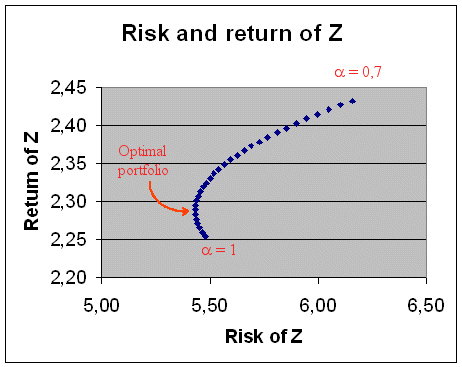
We discover that if we want to put our money into a portfolio made of Coca-Cola stocks and Compaq stocks, the portfolio with the least risk is 95% Coca-Cola + 5% Compaq. And this portfolio is superior to Coca-Cola alone.
Let's get these points stressed upon once more :
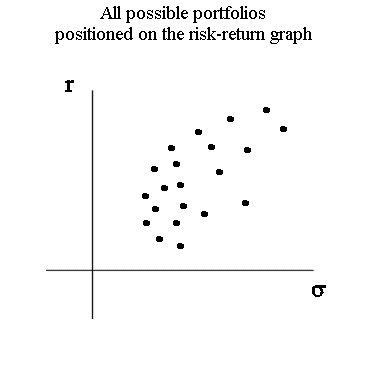
Portfolios made of more than two securities :
Everything that we did so far combining two securities can be done combining more than two securities.
The ideas and formulas are straightforward extensions of the two-security case. We consider, say, p securities
S1, S2, S3, .... Sp
A portfolio Z combining these p securities will have the construction formula :
Z = α1S1 + α2S2 + α3S3 + ... + αpSp
where α1 + α2 + α3 + ... + αp = 100%.
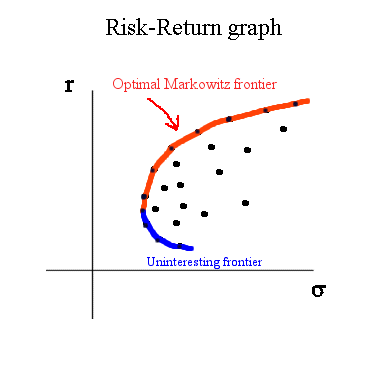
Every portfolio Z that can be constructed like this, from our p securities, will have a risk and an expected return. Now the shape of the picture of all these portfolios is no longer a single curve (depending on one parameter α), but a whole region of the risk-return graph.
Yet this region has a simple shape. It is convex.
And it has an "optimal Markowitz frontier" (also called "Markowitz Efficient Frontier") :
Portfolios including Treasury bonds :
As we did before, in the case of two securities, if we add, following Tobin's idea, Treasury bonds to the collection of possible securities, and if we allow borrowing money (at TB rate) to invest even more than the money we had at the outset, then the Markowitz frontier becomes a straight line going through TB and tangent to the previous frontier at a point M.
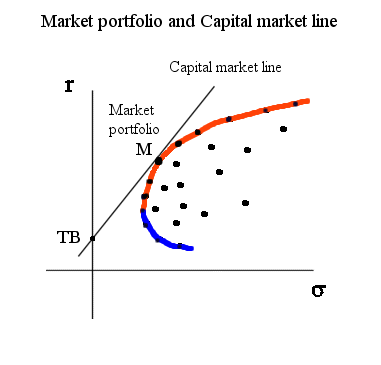
This line is called "the capital market line".
(Note : a "cousin" line, that we shall meet in a few minutes, is "the security market line" : instead of the σ in abscissa, we put the β (defined below). But since, for securities with no specific risk but only systematic risk (defined below), σ = β x market risk, the two lines carry the same information : the optimal securities are on a straight line going through TB's and the market portfolio.)
It can be proved that, in a well functioning market (the so-called "perfectly efficient" market, studied and so named by Eugene Fama), the market portfolio M is a combination of all the securities available for trade in that market. (However "Efficient Markets" are an over simplification of the behavior of stock markets, see for instance Le mythe funeste des marchés efficients by Jean-Philippe Bouchaud.)
In practice, the market portfolio is well approximated by 30 to 50 selected representative stocks in the market. In the NYSE, and in the market of industrial firms stocks, this is the role of the Dow Jones Industrial Average index, which is the performance of a fictitious portfolio averaging several industrial stocks, with varying representative performances.
The Standard and Poor's composite index is a better approximation of the market portfolio, but it encompasses more stocks and more calculations.
The market portfolio M expected return is the average of the expected returns of all the stocks making it up.
It can also be shown that the variance of the market portfolio M is the average of the covariances of all the pairs of stocks in the market.
Introduction of the portfolio M simplifies considerably the calculation of the optimal portfolios (see below).
In some sense all the interesting and useful information about the stock market is encompassed in the market portfolio M. We saw that this portfolio is a certain combination of all the stocks in the market.
For any security S in the market, we define
βS = Covar(S, M) / Var(M)
The coefficient βS measures the "reactivity" of the security S related to movements in the market portfolio.
A security S with βS = 2 is "highly reactive". This is the case of high-tech securities. When the market profitability outcome under consideration is 15% above its expected value rM then the security will be (in a conditional probability sense), on average, 30% above its mean value.
Here is the plot of a security with a β slightly less than one :
(to be precise, the figure below is a scattergram of a collection of joint outcomes of the profitability of the market and the profitability of S, in a series of replications of the experiment producing the market and S)
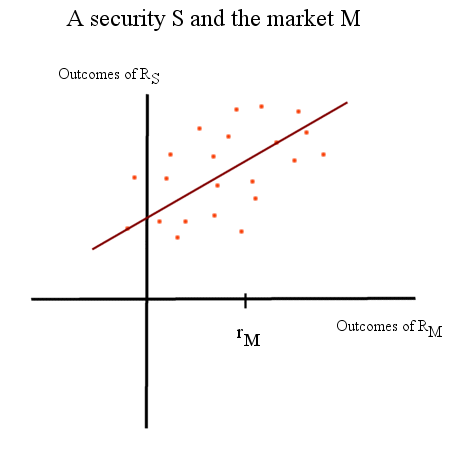
The coefficient βS is the slope of the line, that fits best (in some precise mathematical sense) through the scattergram of (RM, RS)
The fulfledged CAPM was developed by Sharpe, a student of Markowitz, in the early to mid sixties, extending the ideas of Markowitz and Tobin. The names of Treynor, Lintner and Mossin are also associated to these developements. They all independently developed just about the same ideas around the same time, the early to mid sixties. The Nobel Prize credit went, in 1990, to Markowitz and Sharpe, together with Merton Miller, who also did work in the field (but whose name is mostly associated to Modigliani's for work on balance sheet liability side structure, and related topics - the Miller-Modigliani equivalence theorems -, a subject we shall study next semester). We give here only the whiff of the CAPM theory.
Here are the fundamental results and formulas of the CAPM :
Having defined the coefficient β's for any security S, it can be shown that the profitability of S is given by the simple relation
rS = rTB + βS (rM - rTB)
That is, the profitability of any security S in the market is a linear combination of the risk-free rate and the rate of the market portfolio, where the slope is the coefficient βS.
In fact, simply enough, the standard theory of portfolio, which culminates with the CAPM, states that any security S has a random profitability RS which is linked to the random profitability RM of the whole market by the following simple relationship :
RS = rTB + βS (RM - rTB) + εS
where εS is an extra noise, specific to S. The variability of εS is the unsystematic risk of S, and is independent of the market conditions (i.e. of the random variable RM).
The risk of the security S is given by
σ2S = β2S * σ2M + Var(εS)
where εS is the "extra noise" specific of S.
β2S * σ2M is called the systematic risk attached to S. It is simply the "risk of the market amplified by the β of S".
Var(εS) is called the specific risk of S (also called unsystematic risk of S). That is the one that diversification dampers down.
This straight line relating rS and βS is called "the security market line" :
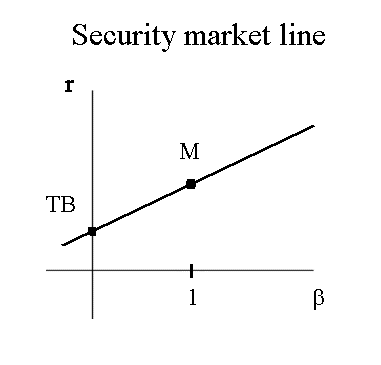
Pay attention to the fact that on the Security Market Line graph, the abscissa variable is the β coefficient. (Note, also, that, for securities with no specific risk, σ = β x market risk ; so in truth, this is not a really different line from the Capital market line, we changed the scale on the abscissa. )
In a well functioning market, all securities in the market are to be found on the Security Market Line. This is the fundamental result of the CAPM theory.
There are books, agencies, and websites that publish the β's of the securities of the stock market.
For instance, Brealey and Myers textbook (6th edition, page 174), give the following table of β's (dating somewhat) :
| Beta's for selected US common stocks | |
| (August 1993 - July 1998) | |
| Stock | Beta |
| AT&T | 0,65 |
| Bristol-Myers-Squibb | 0,95 |
| Coca-Cola | 0,98 |
| Compaq | 1,13 |
| Exxon | 0,73 |
| General Electric | 1,29 |
| McDonald's | 0,95 |
| Microsoft | 1,26 |
| Reebok | 0,87 |
| Xerox | 1,05 |
We see that "sedate" blue chips have low beta's, while more "high tech" firms have beta's higher than 1. This means that the latter are more reactive than the Dow Jones index.
There is much more to say about the CAPM - including that it does not work
very well.
- A paper by a pure follower of betas.
- An example of literature designed to
impress the gullible.
- Some
criticisms
of the standard portfolio theory.
But we shall only make a very simple use of the equations of the CAPM in subsequent lessons (during the second semester of this course)
For instance, retrospective studies of past US stock market data show that the average return of the market portfolio (of large industrial firms in the NYSE) has consistently been roughly 8% points above the TB rate no matter what that rate was. Therefore knowing what is the β of a security, and anticipating what will the TB rate be in the future (in the US it is expected to climb to three percent or more this summer) gives an estimate of the future return of that security.
It is a nice theory that purports to explain the behavior of a security profitability, links it to the whole market behavior, and distinguishes between the systematic risk that is linked to the market variability via the β multiplicative factor of the security, and the specific risk of the security that is akin to an extra random generated variability and does not affect the price and profitability of the security. That latter one can be "diversified away" by creating a portfolio of several securities with the same β.
The main value of the CAPM is to offer a tentative framework of explanations. As such it clarifies the functionning of the market and the job of an investor. But it is far from the end word on it.
We believe that the fundamental analysis of the value of a firm via a thorough examination of its accounts, operations, markets, competitive positions and prospects per competitive segments, that is "separate competitive arenas", (like I used to do when I was a strategy consultant) remains the best way to evaluate a firm, its value, and the attractiveness of its stock at a given price. It relies on the implicit notion of "true value" (also called "real value", or "intrinsic value") of a firm, which may or may not be reflected by its current price in the stockmarket. This concept of "true value" has puzzled financiers and economists for centuries.
As always in Sciences, when a debate (here on the "true value" of something) has gone on and on for eons, the solution will eventually come from outside the framework of thinking within which the debate has taken place. In short, a new theory of value and exchange is called for.