|
Why this review of accountingValue and time
Before getting into the study of finance we review accounting. The reason is
related to the problem of value and the problem of time
in finance. Double-entry accounting is concerned
with value, but not with time
The problem of value also pops up in accounting. In fact double-entry accounting
was invented to keep track of value as opposed to just keeping track of cash as
does single-entry accounting. Remember: a IOU from a client promising to pay us
in 45 days is not cash but has value and this is why it is recorded in the
assets of our firm, but in another account than the cash account. It is recorded
in a "debtors account", and, as should be, in a debit column. At the same time,
whatever is the other leg of the transaction, is recorded in the credit column
of another account. So we review accounting to see exactly how this technique
records value.
The recording of value by accounting is not perfect, but it is robust.
For instance, we know that fixed assets are recorded and the records kept at the
acquisition cost, which is not very realistic. But other techniques to account
for the variation in market value of our fixed assets are intricate and in the
end less reliable than the usual procedure. The first measure of
the value of a firm by double-entry accounting is the Net Worth (total assets -
external liabilities), but this is rarely the value a buyer will pay.
The value of a firm
A buyer will pay the following price:
- if the acquisition has no interference with the buyer's
activities, the buyer will evaluate the future cash flows of the firm ("as a
standalone") and pay accordingly a value representing "the value today of
these CFs". It is then called a financial investment
- if the acquisition interferes with the buyer's activities,
the buyer will evaluate the future extra CF of his firm + the acquisition and
pay "the value today of these extra CFs". It is then
called a physical investment.
This explains why eBay paid $2,6 billion for Skype which
was a young small firm with a negative net worth.
Accounting is not fundamentally concerned with time.
In budgeting we do look at future sales, expenditures, cash inflows and
cash outflows, but not in any sophisticated way. In particular we do not
"discount" anything. A present promise for a cash payment in 3 months, or in 2
years, is recorded at its face value (i.e. the value of the payment when it
comes). Finance is fundamentally concerned with
value and with time
Finance, on the other hand, is fundamentally concerned with value (as is
accounting, but even more fundamentally than accounting, which is somewhat
casual as we saw), and with time (unlike accounting). There is the saying
"Finance looks at the time value of money", which has a rather cloudy
meaning unless we know exactly what is meant by that. This course will explain
us the exact meaning of that sentence. Every
future possession is measured in term of its present value
Finance is concerned with the value today of promises of becoming the owner of
things in the future, or receiving some cash payments in the future. The value
today is quite different from the nominal value of what is to be received.
Third important concept in finance: risk
Finally finance is concerned with risk. Two promises to receive the same value
at the same date in the future, will have different values today if they have
different risks. Probability theory
Elementary probability theory will be put to use, in finance, to measure risk
and link it to the value of risky securities. Paradoxes
in finance
General Electric, for many years, made more money from its financial
activities (lending to its clients) than from its industrial activities. More
comments: listen to the audio notes.
Review of accounting
Learning how to read and interpret final documents
We continue reviewing accounting concepts and procedures, going rather fast
because all of you already had an accounting course, but a brush up is useful
in order to be well prepared for finance (Here is a
detailed review for students who are not yet at ease with the basic
accounting procedures). Today we shall study the final
documents of a firm over several years. The idea is to learn how to read,
understand and interpret final documents, balance sheets and income statements.
What do they tell us about the firm? How is the firm doing?
An income statement records certain movements in and out of the firm
between two dates
An income statement is a means of recording what happened in a firm (movements of
value in and out related to the operations of the year: the value coming in from sales, and the consumption of value to "create" theses sales. The acquisition
of a van that will be used 5 or 10 years does not appear in the income statement) between two dates, t1 and t2. But its yearly amortization will. The income statement can be compared to
a movie. Usually it is computed between the beginning and the end of a
calendar year, but it could be any two dates.
A balance sheet is a snapshot of the firm at a given date t
A balance sheet records the state of a firm at one date t. It can be
compared to a snapshot. A balance sheet can be computed at any date, but
since it is a rather tedious process, it is usually done for the 31st of
December (end of the day) of every year. And the completed calculations are
usually ready no earlier than March or April of the following year.
To the sum of the assets corresponds an equal sum of liabilities
A balance sheet records all the assets
in the firm, and all the liabilities, which are at the origin - globally - of all the
assets. The very first balance sheet, at the beginning of the firm, is somewhat
special ; it is, simply enough, two accounts: on the liability side,
Capital, for instance, 300 000 €, and on the asset side, Cash 300 000 €. But
then this cash will be used for many expenditures. It will not stay 300 000 €. (From
now on, I will assimilate cash and bank; what we mean by bank is "sight
deposits", money that we can withdraw whenever we want, and that, usually, does
not yield interest.)
Asset side: concrete. Liability side: more abstract
The asset side of a balance sheet is something very concrete. It lists
"things" which are in the firm and that you can, for the most part, see and check. Whereas
the liability is more abstract. You cannot "see" the capital account. The 300
000 €, which, at first, were deposited as cash, have been transformed many times.
To understand the difference, think of a house and to whom it belongs: the
house is concrete, you can see it; to whom it belongs is abstract, you cannot
see it, and it does not affect the house.
Performance ratios
One of the topic of today will be ratios: profitability ratios,
liquidity ratios, efficiency ratios, and investment ratios. We will discuss
again the process of value creation, and value measurement.
Economic and financial information
The importance of reading the economic and financial press
Students must read every week several newspapers and magazines. I recommend
a daily, the Wall Street Journal, and a weekly, The Economist.
Financial information of Google. Yahoo finance
Google was introduced in the stock market in August 2004. The
introductory price was $85 per share. On the very day of introduction it climbed
to $100. The firm issued new shares, and the founders also sold a fraction of their
own shares (here: a blurb on the fundamental difference between the primary and
the secondary stock markets). The firm cashed in a little less than $2 billion dollars (figure to
be checked). It will be used to finance various developments. As of September 2006, most of this cash remains in the balance sheet in a very liquid
form. Within a few weeks after the IPO (Initial Public Offering), the share price reached $200 and fluctuated there for
several months. Then, in 2005, it climbed to $300. So, people who bought Google
shares in August 2004 multiplied their investment quickly. The story of Google is a
topic for the presentations of the end of November.
eBay and Skype
Some comments on the purchase, in 2005, of Skype by eBay: Skype is small company which developed a software to phone freely via the
Net all over the world. It is a creation by the same people who developed KaZaa.
Skype was founded in 2003, its turnover in 2004 was $7 million (Source: Le
Monde, to be checked), and its
accounts show only losses. Yet eBay paid $2,6 billion for it. This is a striking
illustration of the fact that value is not directly represented by balance sheet
figures! More on this later.
Oracle and Siebel
In 2005, Oracle acquired Siebel, the specialist of CRM (Customer Relationship Management), for $5,85
billion. Siebel turnover $1,3 billion. Siebel share price plummeted in the
market from $100 in 2001, to around $10 these days.
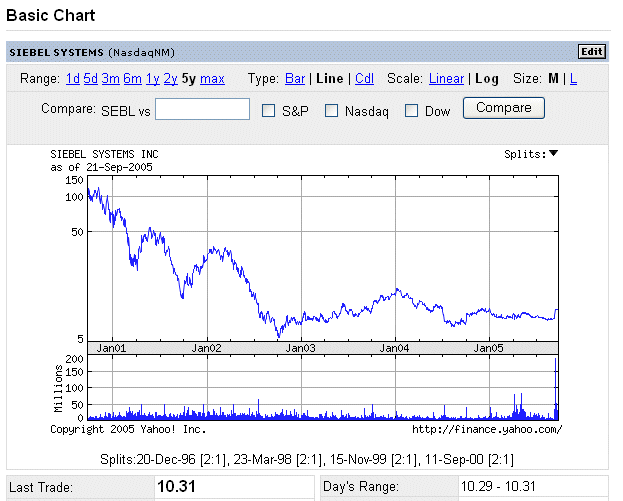
Yet, Siebel was a star of the new CRM field and of the market in the late
90's.
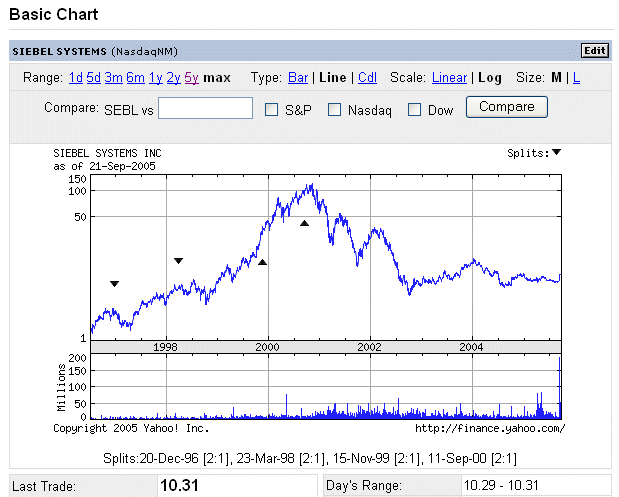
They obviously met problems, which I haven't looked into. These two subjects
are topics for the November presentations.
We will look, later in the lecture, at the accounts of Google. When we look
at a firm's accounts we must be aware of two things:
- there is only one way to do double-entry accounting (except for
some minor choices in the establishment of the accounts, for instance
depreciation)
- each firm has some specificities in the presentation of its accounts, and
it always requires some effort to understand exactly how it organized and
presented its accounts. So do not be put off if, at first, you don't
understand entirely all its accounts; it is normal.
An example of final documents over two years
We will start with an initial balance sheet at the end of 2002 ("snapshot"),
then an income statement over 2003 ("movie"), then the balance sheet at the end
of 2003 ("snapshot"), and then, same thing over 2004 and at the end of the year.
More casual presentation: 1) vertical presentation
I use the vertical presentation of balance sheets, because it will be simpler
then to view the evolution of figures.
(units: thousand of euros)

More casual presentation: 2) no more Debit and Credit
columns
Secondly I no longer use the two columns debit and credit, I use only one,
and I use minus signs here and there. This is a very typical presentation. You
must be able to read it with ease: the total assets is 530 000 euros, or 530 Keuros, and the total liabilities is, of course, the same figure. You must know
whether any figure is a debit or a credit.
Gross and Net Fixed Assets
The "Gross Fixed Assets" is 350. It is the sum of intangible fixed assets
(patents, capitalised R&D, etc.), land, buildings, machinery, transportation
equipment, and financial fixed assets (holdings of shares of other firms, but
firms which are not consolidated into the balance sheet of the one under study).
And the "Net Fixed Assets" is 200.
Current Assests
Then we go to the Current Assets: stocks, client paper (also called debtors,
also called receivables), short term financial holdings (cash that has been
parked into short term securities like Treasury bonds, in order not to leave the
cash idle, but to keep it very liquid), and cash and bank (when I say "cash", I
mean "cash and bank"). The Current Assets is 330.
Liability side
On the liability side: initial capital, 300 (suppose this is 1000 shares
issued at the beginning of the firm and each share was worth 300 euros, so the
initial capital is 300 K€; note that 300 € is the initial price of a share, it is
not the market price today); cumulated retained earnings (that is profits
from the past that were not distributed as dividends, but were retained in the
firm), 50; bonds issued by the firm, 0; long term debt (also called long term
borrowings) to a bank, 100. The sum of these number is called "the Capital
Employed" (also called "Funds Employed"): it is the source of financing that costs money (either in
dividends or in financial charges, coupons and interest). Here the CE (capital
employed) is 450.
Working Capital
Remember also that the "Working Capital" is defined as the Capital Employed
minus the Net Fixed Assets:
WC = CE - FA = 250
(When we don't specify gross or net fixed assets, we usually mean net fixed
assets.)
Current Liabilities
Finally we turn to the Current Liabilities. Roughly speaking, it is the source of financing
that comes for "free", just from running the business. It does not cost any financial charges; running a business,
after a while, gives us access to some free financing (suppliers credit, delayed
taxes, etc.) We owe 50 to our suppliers (also called trade creditors), and we
owe 30 to other creditors (typically taxes due to the state, dividends not yet
paid to shareholders, some accruals, etc.).
Income statement between the end of 2002 and the end of
2003: the 2003 income statement
Now we go to the income statement for 2003. There is at least one figure we
already know: it is the "Opening Stocks" in the computation of the COGS (Cost
of Goods Sold), 100.
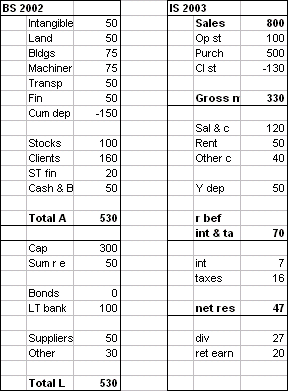
It records the evolution between the BS (balance sheet) at the end of 2002
and the BS at the end of 2003 (that we shall see in a moment).
Handle the casual presentation with care
You have to pay close attention to the fact that most figures are to be
subtracted. It may be confusing at first, but this is the way accounts are
usually presented, and you get used to it very quickly.
Sales, COGS and Gross margin
Sales : 800 K€. COGS : 470. Therefore Gross Margin (also called
Gross Profit): 330. We note that Gross Margin / Sales = 41,3%. It is a typical
figure for a store. The inverse figure Sales/GM is called the multiplier: here,
it is 2,4.
Operating expenses
Then we go to the operating expenses, those expenses which are
consumed and are necessary to run the operations. The first three are called "Cash
Operating Expenses". Salaries and charges: 120. Rent: 50. Other cash operating
expenses: 40. And there is the depreciation of the year: 50.
Non cash operating expenses. Value is consumed, but no
current cash
The depreciation of the year is not a cash operating expense. It is
here in strict application of the matching rule. Sometime in the past, capital
investments were made (and paid for at some point) but they were not recorded as
yearly expenditures. They correspond to expenditures over several years (if a
piece of machinery lasts for 10 years, every year you "spend" a tenth of it). So
every year we remove a bit of value from the Gross Assets (in the account called
"Cumulated depreciation") and we record a (non cash) expenditure in the IS
(income statement).
Result from operations
We reach a figure called "Result before interest and taxes": 70. It is an
important figure because it is the amount of value generated by the firm,
disregarding the financial structure of the liabilities, the cost of the capital employed and the taxes.
It is a pure operation profit.
Financial charges. The yearly cost of borrowed money
Then, interest (also called "Financial charges"): 7. It is the cost of the
bank borrowings and the bonds. Taxes: 16 (I
took 25% of the result after financial charges. It
varies from country to country, and it depends upon current laws. But 25% is a
typical figure. )
The bottom line
This leads us to the Net Result (also called "Net Profit", or "Bottom line",
or "Net Income"): 47.
Dividends. Expenditures after the bottom line
The firm decides, in the General Meeting of shareholders, to distribute a
part, 27, as dividends, and to retain the other part, 20, in the firm. The
dividends will be paid sometimes during the first months of 2004.
Similarly, the taxes due to the state are to be paid, usually, before September
2004. So, for a while, these two figures will remain a liability in the BS of
the firm. Remember that this IS, and the BS to come, are established in the
first months of 2004. So the figures are not known before, say, March or April of
2004.
Balance sheet at the end of 2003
The three documents below are linked by some arithmetical
constraints
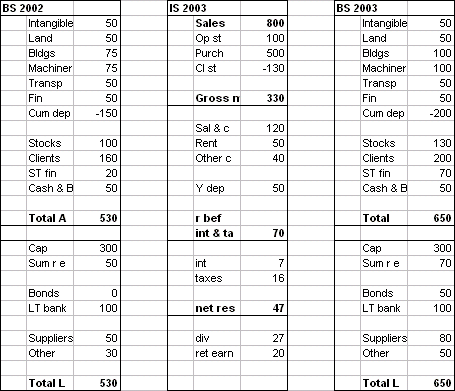
Assumption: no divestments
In order to keep the reading and interpretation of the accounting documents
simple, I assume that there is no sale of assets during the year 2003. So, for
instance, we readily see that the investments in FA (fixed assets) were 50.
Secondly, the various depreciation figures jibe: yearly depreciation, 50 ->
increase in cumulated depreciation, 50.
Cumulated retained earnings
Another constraint in the 2003 BS is the cumulated retained earning figure:
it must be 50 + 20 = 70.
Cash account and cash flow statement
There are a few more constraints, but there are less visible. One of them
concerns the cash account. A special document, called the Cash Flow
Statement, will analyse the origin of the movement in the cash account.
(Here it staid at 50.)
Purchases, stock variations and COGS
We see that the stocks went up, so the COGS is less than the Purchases. The
client account went up: we must make sure it is not a sign of selling to bad
clients. We had too much cash, so we increased our short term financial
holdings.
Money was borrowed during 2003
The firm issued bonds during the year 2003. So now we have a bond figure on
the liability side: 50. (This example does not purport to illustrate yet sharp
financial management; for example to issue bonds, and then to invest a part of
them in ST (short term) securities usually does not make much sense; it
depends on the state of the money and financial markets.)
Capital employed
The CE (Capital Employed) is now: 300 + 70 + 50 + 100 = 520. Remember,
Capital Employed is, on the liability side, "the money that costs money". It is
a very important measurement of the means (the financial means) used by
the firm in the process of value creation. We will see, later in this corporate
finance course, that the firm must be able to make investments that produce more
profit than the cost of the capital employed, otherwise the shareholders will
lose value. It is a bit early to study, but the intuitive rationality of this
should be clear.
Financing the firm requires long term money.
The two sources, each of them
split into two sub-sources, are
- money from shareholders
- from issue of new shares
- from retained earnings
- money from borrowings
- from the financial markets (issue of bonds)
- from regular banks (debt to banks)
Capital employed (cont'd). Choice of leverage
The sum of all this is the "Capital Employed".
It is the financial means that
the firm will put to work to create value. The choice of how to structure the CE
(capital employed) among the sources is a financial decision that has no effet
on the sum of it, nor on the result before interest and taxes.
The importance of the capital employed figure
From a financial point of view, the capital employed is a more important
figure than the sales. After all, it is easy to artificially inflate the sales:
purchase more, and sell the extra purchases at about their acquisition value (for instance, via
subcontracting)... Whereas the CE are a meaningful measurement of the size of
the firm.
Working capital
The working capital, at the end of 2003, is CE - FA = 520 - 200 = 320. It
is the part of the Current Assets financed by money that we have to pay for.
Usually it cover all, or part of the stocks, and possibly a part of the client
account.
One more year
We continue with the year 2004: income statement, and balance sheet.
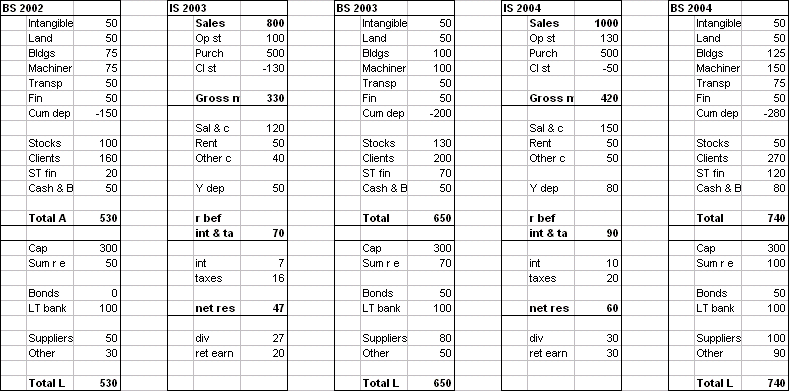
Exercise: check by yourself that you see the evolution of each item, and
that they make sense.
Questions
- What are the COGS in 2004?
- What is the Gross Profit Margin in 2004?
- Do the cumulated depreciation figures jibe with the 2004 yearly dep?
- What is the income tax rate in 2004?
- Do the cumulated retained earnings at the end of 2004 show the increase
due to 2004?
- What are the investments in FA (fixed assets) in 2004?
- Do the client pay well?
Financial analysis
Studying the evolution of accounts over several years is called Financial
Analysis. There are tools to do it. Some of them are the ratios, which we will
presently study. The Cash Flow Statements (akin to the Sources and Uses of
Funds) are other tools.
Shortening of the time span of financial analysis
Financial Analysis used to be carried out over 10 years, but nowadays the
business world evolves so rapidly that the accounts of a firm ten years ago bear
little relation to what it is today. Therefore, now, Financial Analysis over 5
years is usually sufficient.
Inflation
The accounts presented above are with "current monetary units". We did not
introduce the concept of inflation. And we assumed, implicitely, that inflation
did not play a role.
Decline of purchasing power of a unit of the currency
There is inflation in a country, or a monetary zone like the euro, when a
unit of money sees its purchasing power decline over the years. Here is a
real life example: a typical basket of goods and services for end consumers, in the US,
that costed $174 in the year 2000, costed only $55 twenty five years earlier, in
1975 (see US inflation data). Of course, it is
difficult to define "a typical basket of goods and services" over several years.
That's one of the technical difficulties of computing inflation. Here is
another example: a man haircut, today, in the US, costs about $20; in 1975, it costed about $5. Yet, there was no big technological improvement in hair cutting,
that would justify this price increase; it is just inflation.
Inflation is a curse in a society.
It corrupts contracts with fixed payments.
Borrowers like inflation: they borrow, say, $100 000, to be refunded over 20
years; and, year after year, the real purchasing power of their payments back
decreases. A friend of mine told me that when he borrowed money to buy an appartment in 1970, at first his yearly payments were close to 1/3 of his
salary. But when he finished paying, some years later, the same yearly payments
were only 2% of his salary. The lenders got gypped. Inflation destroys social
ties. The most famous example of hyperinflation in history happened in Germany
in 1923: a sum of money, in marks, that bought a house at the beginning of the year,
did not even buy the doormat at the end of the year.
Deflation also plays havoc with a society.
When there is deflation
(when prices and salaries fall), it is tough on people who are indebted. This
was the case in the United States at the beginning of the 30's. At the end of
1931, industrial prices were 24% below their 1929 level. In 1932 and 1933 the
consumer prices were also 24% below their 1929 level. Firms went bankrupt from
less sales; many people reduced their purchases to meet their fixed obligations
(in particular their rent, and their mortgages); unemployment soared; banks
went bankrupt because their clients defaulted (in 1929, there were 25 000 banks in the US; in 1933, there were
only 14 000). In late 1932, stock prices on the NYSE (New York Stock Exchange)
were at only 20% of their October 1929 level. At the worst point, in early 1933,
almost one in three workers was out of work. The US economy did not entirely
recover until 1941.
Inflation also makes balance sheets less meaningful than they are.
Indeed Fixed Assets are recorded at various historical values in the past, and
liquid assets, by definition, are recorded at values near the present. So the
two are not comparable anymore.
Deflated time series of economic figures
It is possible to try and represent a series of yearly monetary figures
corrected for inflation. (We also say deflated.) Then we have to
specify with which yearly unit we represent it. Here is an example:
The evolution of the US balance of payment since 1971.
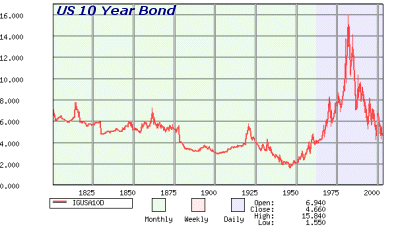
In the West, inflation had all but disappeared from
1980 to 2000. the role of Paul Volcker
Recent textbooks no longer mention much inflation, because it has been more
or less eradicated in the 1980's, after the Conservative revolution, initiated
by Margaret Thatcher and Ronald Reagan, which then took place in all western
developed countries. In 1979, Paul Volcker, the head of the Federal Reserve Board
of the US, at the time, decided to restrict the growth of the money supply and
let the interest rates evolve freely. They briefly climbed to more 20% in
1980/1981. At the same time price inflation all but vanished (it had been 13%
in the US in 1979).
Interest rates
Recent interest rates were these:
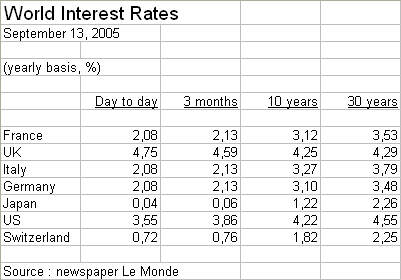
We shall have several opportunities to glance at this table. Here are some
first comments:
- these rates (except for the first column) result from supply and demand on
financial markets
- the first column result from decisions by central banks
- most rates (they are all yearly rates) are increasing with the
duration of the loan (except in England, and this is an unusual situation)
- if you believe short term rates will not increase in the future, and you
need, in France, euros over ten years, you should borrow on short term, and
regularly renew your loan
- but if you believe the short term rates will increase, and increase to
possibly more than 3,12%, you should secure a loan at 3,12%
- these rates are the cost of the risk incurred by lenders, they also, in
part, represent anticipation of inflation
We have entered into a new inflation period
The present huge imbalances in world finance caused by the US deficits, as
well as some big European budget deficits and public debt, feed a fear of future inflation.
(Inflation wipes out imbalances - but it also wipes out trust in money, and
destroys the social fabric.) More on this later.
The
problem of characterising what is value
It is not meaningful to talk about "the value of the dollar", or "the value
of the pound" without any further specification of what we mean.
The value of something is always with respect to something else, in
a potential exchange.
Here is an illustration (in French, to be translated) of values, and of
contracts:
Voici un
exemple du problème: à la date t1, vous avez emprunté £100 ; vous
avez donc donné une reconnaissance de dette de £100 à un prêteur et reçu en
échange £100 en billets. A cette date t1, £100 en billets achètent,
mettons, 25 onces d'or. Quelques temps plus tard, à la date t2, vous
devez rendre le principal de votre prêt (laissons de côté les intérêts payés par
ailleurs). A cette date t2, £100 achètent, maintenant mettons,
seulement 22 onces d'or. Alors, à cette date t2, devez-vous rendre un
total de billets faisant £100, ou bien devez-vous rendre £113,6 pour que le
prêteur puisse de nouveau avoir, s'il le veut, 25 onces d'or
?
Answer: it all depends the
contract you entered into with the person that lent you £100.
(A blurb on the Bullion
controversy, the currency school, and the banking school.)
In 2003, gold was worth about $300 an oz, and oil about $25 (figures to be
checked). In October 2006, gold is worth $600 and oil about $60. We could invert
the relationships. But the question is: "what is the value of a dollar?"; and
more to the point: "what does this question mean?"
Would it have been a good idea to park one's idle dollars into gold, or into
oil, in 2003?
Or would it have been better to invest them into "productive" investment? (It
is hard to think of a less "productive" investment than to buy gold.)
Why is the price of gold going up, anyway, since 2004?
Economic
agents and accounting documents
Very powerful documents
The end of the year final documents, the income statement and the balance
sheet, are very powerful tools to see quickly the performance of a firm.
Any economic agent can establish its own IS and BS
It must be noted that, with minor adaptations, income statements and balance
sheets can be computed for other economic agents, such as individuals (or
families), cities, regions, governments, and countries. There again, they provide a
very useful tool to see the economic performance of these agents.
Do not mix up a government and a country. For instance, in the US nowadays,
the trade deficit of the whole country is in the vicinity of $700 billion ;
whereas the budget deficit of the federal government is about $400
billion. The two deficits are called "the twin deficits" of the
United States.
A paradox on value
A producer of goods (industrial or agricultural) may see, during a year when
his production was relatively low, the unit price of his goods increase so much
that his total revenue, when selling the goods, is higher with a smaller
production than with a higher one. This paradox was first mentioned by Gregory
King (1648-1718).
As a consequence of the way GDP (Gross Domestic Product) is computed, a
country producing 100 000 tons of peaches may have a GDP, that year, higher than
another year when it produced 200 000 tons !
This stems from the monetary measurement of value. Value is an elusive
concept. The modern understanding of the value of a banknote or of goods is
simply the class of things we can get in exchange for them. In fact, even this
definition is rejected by some modern theoriticians of value; they say that
values are different for different people.
This paradox will not concern us much in this course, but we should be aware
of the subtlety of the concept of value.
Break time
Go to part 2 of lesson 3
|


