Advanced financeLesson 7: Equity markets
Today's lecture is about equity markets (textbook: Levinson, chapter 7). Depending upon one's view point, shares of equity are the simplest financial instrument, or the next simplest after "plain vanilla" bonds. We saw that a plain vanilla bond is a loan contract between an investor and a borrower, where the investor supplies a sum of money (the face value of the bond) at the signature of the contract and then the borrower refunds the investor according to a time schedule. A share of equity is a title of property on a part of a project, incorporated into a business firm. Its main financial attractiveness is that it gives the right to receive dividend payments when the firm pays some, which is usually the case if the firm is profitable. We shall take the opportunity of this lesson to review the role of time and of risk in finance.
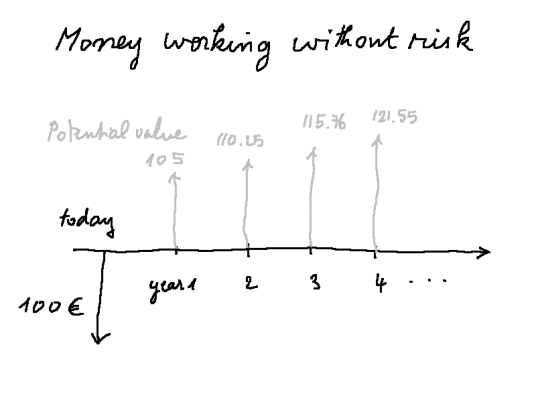
The role of time in finance The greatest difficulty in finance is not stochastic calculus, it is to understand the fact that, under normal economic conditions, if we keep a sum of money in our pocket over a period of time, we actually lose money (in the sense that we give up the opportunity to earn money risk-free). Indeed there is always the possibility to nominally earn money at the risk free rate offered by government bonds of the monetary area where we are. We shall work in the simple discrete model where the shortest time period is one year, and the currency is the euro. All the arguments can be straightforwardly extended to any discrete model with a shorter time period (a month, a day, a second...). And then, with a little bit of maths, we can go to continuous time models. (It requires going from discrete distributions of probability to densities of probability, and understanding the evolution of a random walk over a small time step as described formally by Ito's lemma.) Suppose the risk free rate is 5%. Then if we place today, called date t0, a sum of 100 euros, we shall have 105 euros in one year (at date t1). And if we leave our money in governement bonds, in two years we shall have 110,25 euros; then 115,76 euros, then 121,55 euros, etc.
Because to receive 105 euros in one year, in exchange for 100 euros today, is risk-free ("automatic", if you prefer), from a financial point of view the two are equivalent. The precise meaning of this idea is the following: the value today of 100 euros of money = 100 euros = the value today of a security that will pay for sure 105 euros in one year. We say that "the present value of the future sure cash flow of 105 euros in one year is 100 euros". Therefore to decide that we will keep our 100 euro bill in our pocket over the year to come, is equivalent to saying that in one year we shall receive 100 euros. The present value of 100 euros to be received in one year is the same as a sum that, invested today, would produce 100 euros in one year. Such a sum is 100 / (1,05) = 95,24 euros. This is what is meant by "to keep one's money idle, instead of working, is equivalent to losing money". Of course this is true only in the simple model we just described. There are many other models which justify keeping some money in cash. We shall study them later. Despite the limitations of this simple model, it is fundamental that we understand well what it says: our money must grow at least at the risk free rate. If we don't make it work at that rate, and keep it in our pocket, we may see the nominal value remain steady, but we fool ourselves, because the nominal value should have grown by the risk free rate. There are many heuristic justifications for this risk free rate of growth of our money. One of them is that society as a whole keeps producing wealth. The rate of growth of this wealth is the risk free rate (in a very simple model). Therefore either we make our money work by undertaking a project ourselves, or we do it by lending it to somebody else risklessly, but in either case 5% will be created with this money, and it should go to us. Another disturbing consequence of this fact is that, from a financial point of view, earning over the years the risk free rate is not earning any money at all. Indeed, to have in two years 110,25 euros is the same as having 100 euros today.
The second hard idea in finance is that value of an investment (if there is some) is created instantly, at the moment the investment is launched, not "in the future". When we say that a physical project has a positive NPV, we mean that the sum of the present values of the future cash flows, minus the initial expenditure, is positive. In other word, right now we create value. This surprising fact is only a generalization of the following one: if I can buy today for a price P some asset the value of which today is more than P, say Q, I create, receive, get (call it whatever you like) instantly the value Q-P. Here is an example: if by spending today a sum P, I can create a project which will generate some cash flows in the future, and these future cash flows have the present value Q, again I create right away the value Q-P. So we need to examine more precisely how we compute present values. This requires a structured approach to risk.
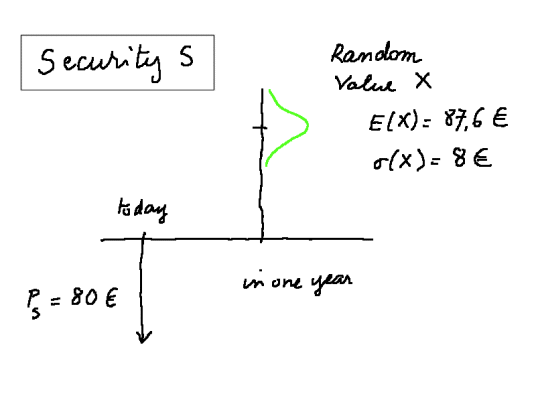
In this section we review cursorily ideas which belong to a first course in finance and probability. The reader is referred to the course Accounting and Finance by the same teacher for details (more specifically lessons 6, 7 and 8). The risk free bond which we saw above is, as its name indicates, without risk, that is, without uncertainty: a price P is paid today, and a sure sum Q will be received in one year. In the example, Q = P * (1 + 5%) Other types of security will produce a unique cash flow in one year, but this cash flow will have some risk: it will be the outcome of a random variable. Technical note: We consider only securities with fundamental variability which cannot be averaged out with a basket of securities of the same type. The intuitive idea is this: if we bought a security the value of which in one year were the outcome of the throw of one die, we would get in one year 1 euro, or 2 euros, or 3 euros, or... or 6 euros, each with probability 1/6. The expected value would be 3,5 euros, and there would be some variability around this mean value. But this would not be a fundamental variability. Because if the market offered many securities of this type, we could "average out" our cash flow next year by putting our money into one hundred securities like that (assuming we could buy one hundredth of each) and in one year we would be sure to receive very close to 3,5 euros. So we would be back in the case of a risk free security. The formalism goes like this: The security is called S
Numerical example:
This is the essential representation of risk in finance: by buying the security S today we acquire the right to receive a sum X in one year, but this sum X is not a fixed, sure sum like with risk free bonds. X can take any value between zero euros, and a large value. X can turn out to be 75 euros, in which case we shall be unhappy. It can be 84 euros, in which case we get the same as with a risk free bond. It can be 200 euros, in which case we are very happy. X has a distribution of probability, represented by the green curve on the figure. It has a mean value 87,6 euros, and a variability measured by its standard deviation s(X) = 8 euros. A fundamental fact of finance is that more risky securities are more profitable. Within the appropriate model, it is a mathematical result. But don't shout victory: the model used in the Modern Financial Theory was precisely selected so that it holds true. Modern Financial Theory, as we said, besides its usefulness, also has some limitations and critics. In particular it does not model well bubble phenomena. Now comes the very important idea of the "opportunity cost of capital" of a projected investment. It is the subject of next section.
We are in the model of one market offering a large number of securities for sale. The time model is discrete and the time step is one year. It is a very sketchy representation of the NYSE. We look at an investment today into a security which we intend to resell in one year. We have information about many securities traded in the market. Newspapers like the Wall Street Jounal, or web sites like Yahoo finance give this type of information on a daily basis. For instance, in our little example, S above is one of such security. Another one is T the price of which today is PT = 120 €, and which has a random value in one year Y, with mean E(Y) = 142,2 €, and standard deviation s(Y) = 36 €.
Suppose we are offered for buying a security U. We are asked to make a bid. Obviously we need to have some information about U. We could ask "What is its price?", but we are precisely asked to make a bid. There is no price yet. We have to make an offer. So we ask: "What will be its value next year?" The answer we receive from our seller (the market player who is looking for money in exchange for his security) is: "It is a random variable Z with mean 50 € and standard deviation 4,57 euros." Now we have to find in the market securities which are equivalent to U, technically which have the same risk pattern. Does U behave like a risk free security? Ans.: No, because it has some variability. The risk pattern of a security U, with value Z in one year, is defined as s(Z) / E(Z).
For instance the risk pattern of risk free bonds is 0. The risk pattern of the security U we are offered is 4,57 / 50 = 0,091 The risk pattern of T is 36 / 142,2 = 0,253 The risk pattern of S is 8 / 87,6 = 0,091
So we see that U "behaves like S" (of course this example is made up, but we can always find in the market securities behaving like the new one we are offered). Then, U must have the same profitability as S, otherwise the market would violate the fundamental fact of finance that more risky securities must be more profitable (see Accounting & Finance lesson 8 part a for a proof). Therefore we must have
that is
this condition on PU is equivalent to
We recognize the fundamental formula of discounting. This is how we get the proper price of U. Since S has the profitability rS = 9,5%, calculation gives PU = 45,66 €. Of course if our seller/borrower accepts a lower price from us, we shall be happy. But the seller would gives us value. On the contrary, if we pay more than 45,66 € we are wasting our money, because we could put it into S (more precisely, into a fraction of S) and get a better yield for the same risk (see Accounting & Finance lesson 8 part a for a more detailed explanation). Now comes the definition of the opportunity cost of capital: the opportunity cost of capital of U is the profitability of another security S, already priced in the market, and behaving like U in terms of risk. We compute the price of U by discounting its expected future value with its opportunity cost of capital.
Conversely, the Present Value of a future cash flow in one year is computed by discounting it with its opportunity cost of capital. Therefore in a financial market, securities are always offered at a price which is the present value of the future value. This is what makes us say: in a financial investment the NPV is always 0. (See section on NPV below.) What we are offered for buying has exactly the value we are asked to pay.
Comment on the opportunity cost of capital: It is a nice simple concept stating essentially that if we have the choice between two investments J and K and "everything else is the same", by investing into J we give up the opportunity to invest into K. So if K is more profitable than J, investing into J has clearly the "cost" of not investing into K. This is well and good. But in the reality of firms operations, choices between various investments are rarely (if ever) so simple. There are the classical examples of studying whether it is appropriate to replace old machines, or if we should rather keep them. But these are classroom examples. In reality a great number of factors, many of them not quantifiable, must be considered by the executives taking decisions. There are externalities. There are considerations on what will be the social impact of our investment decisions (short term and long term). Etc.
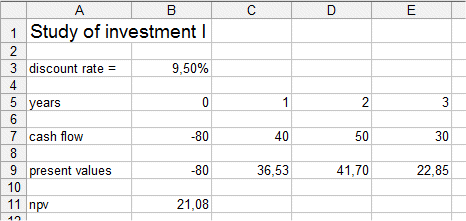
The notion of opportunity cost of capital can be generalized to an investment I which requires a payment C0 today and will produce a stream of yearly cash flows C1, C2, ..., Cm. The opportunity cost of capital of I is the profitability of a security already traded in the market and behaving like I in terms of risk. Then, if r is the profitability of S (that is, the op. cost of cap. of I), the present value of the future cash flows is: PV(C1, C2, ..., Cm; r) = C1/(1+r) + C2/(1+r)2 + ... + Cm / (1+r)m And NPV(I; r) is obtained by subtracting the first cash flow C0.
Numerical example: C0 = 80 million €C1 = 40 mio C2 = 50 mio C3 = 30 mio and this investment as the same risk pattern as S above, that is, it op. cost of cap. is r = 9,5% Then calculations give PV(C1, C2, ..., Cm; r) = 108,08 million € and NPV(I; r) = 21,08 million €
The concept of IRR comes from considering r as a variable and NPV as a function of r. The question we ask ourselves is: for what value of r NPV(I; r) = 0? The value of r which satisfies the equation NPV(I; r) = 0 is called the Internal Rate of Return of I. It is a generalization of the usual profitability we are familiar with when we consider an investment which will produce a value in one year. You can check that the IRR of S (pay 80€ today and get 87,6 euros in one year) is 9,5%.
So to any investment I = [-C0, C1, C2, ..., Cm] are attached two very important rates:
Calculations with the help of the Excel spreadsheet show that the IRR of the investment [-80, 40, 50, 30] is 24,44%. The view of a practitioner on DCF.
We stressed many times that in a financial investment the NPV is necessarily zero, otherwise your seller is giving you value for nothing. In a physical investment things are different: it is possible to have a positive NPV. This comes from the fact that we can sometimes produce a stream of cash flows with an expenditure today which is less than the present value of the stream of future cash flows. This is the case when we take profit of a skill or an advantage we have and that our seller does not have. The example I like to use is that of a violin bow: if I am a violin player, with a violin but no bow, and a potential seller has a bow, but does not play the violin, the bow has little value for him, but has a high one for me because if I buy it, then I'll be able to give concerts and earn good money. There should be a possibility for me to buy the bow at a lower price than the present value of all my future profits, therefore I can produce value right now, as soon as I buy the bow. Of course the seller will try to sell me the bow for a high value. We will reach an intermediate price, somewhere between the value for him and the value for me. Where exactly depends upon the relative bargaining strength of him and me. Remember from lesson 1, Skype owners were able to sell Skype for a high price to eBay (the selling price was $2,6 billion, for a three year old firm with turnover $7 million, and only losses), yet eBay was still making an investment with a positive NPV. The fact that I produce value right now is not deconnected from reality either: venture capitalists give a value to business plans of young entrepreneurs that are only paper projects.
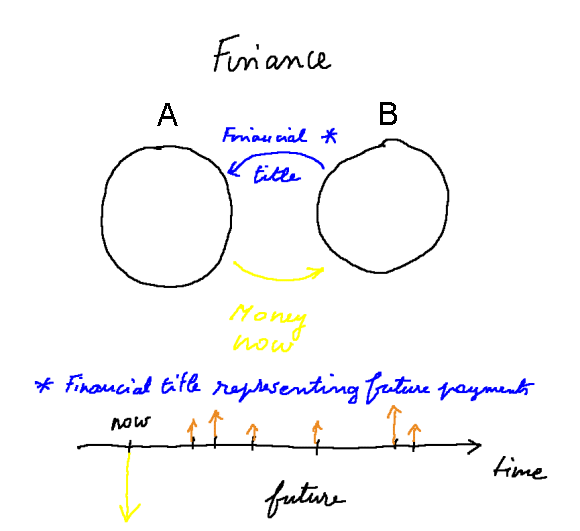
No matter how we look at finance, it is (almost) always about trading some present payments for some future payments. (We must add "almost" to this simple definition to also include trading some future payments for some other future payments, like swaps, or - as we shall study in the next lessons - futures and options...) And these future payments of course present some risk. Bonds try to make them with as little risk as possible, but even though they remain risky. Equity is more risky than bonds.
Graphical representation of a financial transaction (remember both legs of a transaction happen at the same date)
But then, why make such a trade? Well, most of us at one point or another in our life have more money than we need right now, and foresee to need more money in the future than we will be able to generate then. The simplest example, of course, is retirement money. In the old days people would, simply enough, save some gold and silver coins in a jar, or under a mattress, and that would be their savings for the future or for bad days. But we saw that "finance" recommends to make, in the meantime, this money work. One of the many paradoxes of money is that the financial title that A receives from B at the time of the transaction is itself some value which can serve as money. So what exactly is it that A exchanges with B? The conventional answer is that the title is less liquid than legal tender money. This is more or less understandable when the title is equity in a firm, but we know that there exist risk-free securities which are very liquid, namely short term Tbonds. In their case it is even recommended to make the transaction, because the bond will produce more money nominally, but in the future. So we relinquish present money for more future money with the same present value. Then what have we got in the transaction? Ans: some financial title which has the same value as our money but the nominal value of which grows with time, at the risk free rate.
There are more complicated such transactions, that can be paradoxical too. Here is an example: "Rich countries demographics have changed the nature of life insurance. In the past life insurers protected people against the risk of dying too soon. Now they are increasingly insuring against the risk of not dying soon enough (ie, of outliving one's savings). So policyholders do a trade with life insurers: they hand over their piggy banks, and the insurers guarantee them an annuity until death. The risk that an individual turns out to be a Methuselah now lies with the insurer" (from "Economics, Making Sense of the Modern Economy", Edited by Simon Cox, The Economist Press, 2006, chapters on finance, written by M. Levinson). In France, there is the famous example of Jeanne Calment, the lady who was for a while the oldest person on earth, and who died 122 years old. "In 1965, aged 90, with no living heirs, Jeanne Calment signed a deal, common in France, to sell her condominium apartment en viager to lawyer François Raffray. Raffray, then aged 47, agreed to pay a monthly sum until she died, an agreement sometimes called a "reverse mortgage". At the time of the deal the value of the apartment was equal to ten years of payments. Unfortunately for Raffray, not only did Calment survive for more than thirty more years, but she outlived him, and his widow had to continue the payments for twenty more months." (Source: Wikipedia)
Bonds, in French, are called "obligations". They used to be called "titres de rente". Many bondholders in France (called, in the past, "rentiers"), who had put their savings into safe bonds prior to WWI (for instance government bonds, but also Russian bonds), were ruined after the war. This happened in many countries of course. In Germany, in particular, the war and the subsequent hyperinflation of 1923 is held as one of the causes of the rise of the Nazi party, who was popular among the middle class, who had been ruined.
Two German stamps, 1923 and a little later
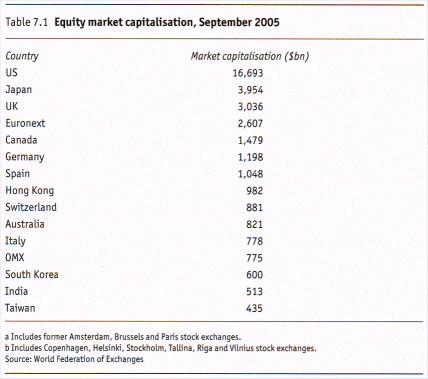
Read Levinson chapter 7. Below is a summary of points to study: As we saw, the amount of outstanding equity products in domestic markets worldwide in 2004 was around $37 trillion. It is also called the markets capitalization. Here is a break down of market capitalization per country in September 2005:
Equity is one of the two main sources of financing. The other is bonds and bank loans. The ratio Financial Debt / Equity + Financial Debt, in the liabilities of a firm, is called the gearing. In the theory of Miller-Modigliani it is irrelevant for the investors into the firm. But in practice it is a ratio managers and investors pay close attention to. Venture capitalists are equity holders.
Types of equity
Issuing shares
Investing in IPOs Share repurchases
Factors affecting share prices
In theory, the value of a share of stock is the present value of all its future dividends. This is true for any investment. It was true for bonds. But for bonds the situation was reasonably easy to handle because the future cash flows are known. (Technical note: for bonds the framework of discounting is somewhat different from that for shares, because we use the "max cash flows" and not the "expected cash flows" that would take into account the default risk each year. But this point can be technically cleared, and the two methods are equivalent to compute the new price of old bonds.) For shares we have somehow to guess what will be the future cash flows (or dividends) in the years to come generated by the share. And this requires to have a discount rate too. Here there is a bit of circularity in financial calculations, in the sense that the opportunity cost of capital sometimes is obtained from observing the current price in the market. For instance, if a share S is priced P = 85 euros, and we believe that its future dividends will be [D1, D1*(1+g), D1*(1+g)2, D1*(1+g)3, etc. forever], where D1 is the next dividend, and g is a regular growth rate of the dividends, then some simple algebra shows that the present value of all the future dividends discounted with a rate r is PV(all future dividends) = D1 / (r - g) Since this figure must be equal to the current price P, the opportunity cost of capital r, of S, can be calculated: r = [ D1 / P] + g Here, as a numerical example, let us take D1 = 5 euros and g = 2%, then we calculate that r = (5/85) + 2% = 7,9%
Now if we know another share T is in the same class of risk as S, and we have reliable estimates for its future dividends, we can check whether it is correctly priced in the market or not. Exercise: suppose T is in the same class of risk as S above, and its future dividends will be [6, 5, 4, 3, 3, 3, 3, 3... forever] and T is currently going for 40 euros, is it correctly priced or not? Answer: a little bit of algebra gives this : let's set r = 7,9% then the Present Value of all the future dividends is 6/(1+r) + 5/(1+r)2 + (4 + 3/r)/(1+r)3 = 5,56 + 4,29 + (4 + 37,97)/1,256 = 43,27 euros so T is undervalued by the market and should be purchased at its going price.
Factors affecting share prices (cont'd)
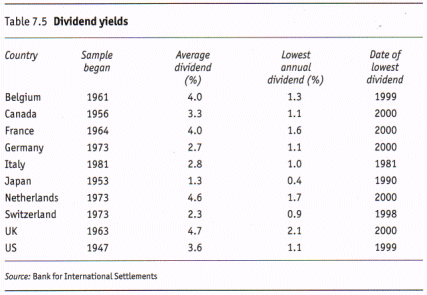
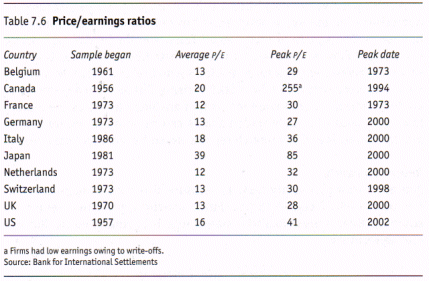
Key numbers
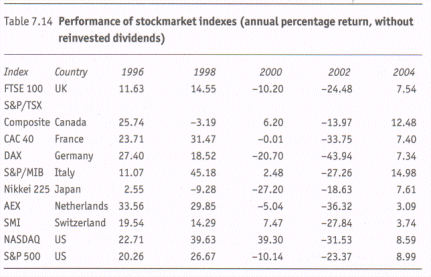
Measuring returns Obtaining share price information
OTC market Stock exchanges The biggest exchanges The overwhelming majority of the world's equity trading takes place on just four exchanges: the New York Stock Exchange; the NASDAQ; the Tokyo Stock Exchange; and the London Stock Exchange. The mid-2005 market capitalizations were respectively (in trillions), $12.9, $3.4, $3.4 and 2.7. International listings Depositary receipts (to tap foreign capital markets without directly listing one's share abroad) Emerging markets
Trading shares How stock exchanges work Competition in trading Institutional trading
Clearing and settlement Investing on margin: investors often purchase shares with borrowed money. Stockbrokerage firms make such loans, known as margin loans, accepting the purchased shares as collateral (just like a mortgage loan on a house). Measuring market performance Price measures
Risk measures : volatilities.
(adapted from "Economics, Making Sense of the Modern Economy", Edited by Simon Cox, The Economist Press, 2006, chapters on finance, written by M. Levinson) In all developed countries, the main players in equity and bond markets are institutional investors:
The small individual player is a sight of the past. The reason is that playing in the stock market requires professionalism and scale of operations, otherwise the commission to brokers are too high and the risk of bad investments that wipe your entire wealth out too high too. Mutual funds are intermediaries which pool the money of many individual investors and invest it professionally in stocks and bonds. They benefit from a scale effect which lowers, in proportion, broker fees. And they can put into practice the know-how of professional investors. Generally speaking, the Anglo-saxon countries have a "culture of equity", while Continental countries have a more risk averse attitude with a preference for bonds. In the United States about 50% of all households have some savings in mutual funds. The US institutional investors have a very important power over firms, due to the amount of money they control. In France or Germany, the large universal banks used to have more power than institutional investors (called "zinzins" in France). But some year ago, the Californian pension fund Calpers by its simple decision to withdraw from Alcatel made the share price tumble 40% in one day, ruining many employees who had been lured into "participation" in their firm.
Are they banks? It is to be noticed that the institutional investors (mutual funds, pension funds and insurance companies) are more and more like banks. Some money market funds offer accounts on which creditors can draw checks, which are accepted in some clearinghouse systems of banks. See for instance the second line in the table below US Money market mutual funds (table L.121)(billions of dollars)
Footnote: Open-end investment companies; excludes funding vehicles for variable annuities, which are included in the life insurance sector (table L.117). Source: Federal Reserve Statistical Release
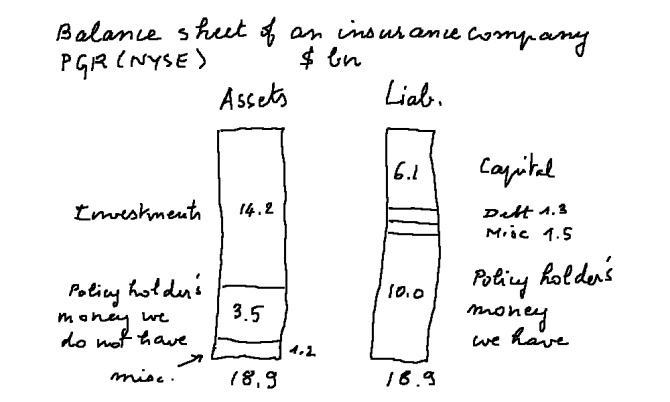
The balance sheets of mutual funds look very much like those of commercial banks, except that on the liability side there is no difference between depositors and share holders. For insurance companies, it is a bit different: there is a difference between share holders and policy holders. Usually profits don't accrue to policy holders.
And for pension funds, the balance sheets are intermediate between those of mutual funds and those of insurance companies, but closer to mutual funds. In the three cases, however, we deal with financial institutions which issue "liability receipts" which are very much alike bank notes and checkable credit accounts.
There is one special category of fund that tries explicitely to make money whether markets are going up or down. So-called "hedge funds" follow complex strategies that combine positions in different securities. A fund might, for instance, bet that the spread between Danish and German government bonds will narrow and buy Danish paper, at the same time selling German bonds. Then, whether Danish rates go down or German rates go up, the fund should make money. Far from being "hedged" however, such strategies can quickly go belly up. This happened notoriously in 1998, when Long-Term Capital Management (advised by the two Nobel prizes, Merton and Scholes who got a bit carried away with the application of simple stochastic calculus to financial random walks), also known as LTCM, ran into trouble and had to be bailed out with $4 billion by its bankers, which makes it appropriately costly to benefit from the advice of so eminent scholars. The academic world, never concerned with such trifles and which has been somewhat self-centered for the past eight hundred years, went on to bestow on them more distinctions. (In sports people like Marion Jones had to hand over their medals, but such practice has not yet reached academia.) Because they are risky, hedge funds are mostly private partnerships instead of public companies, and most regulators allow only the rich (and supposedly savvy) to invest in them. It should not come as a surprise that Merton was a student of Samuelson's, two academics who thought that classical mathematics could be applied to problems in economics. Nowadays, it is understood that the new maths of complex dynamic systems will be more useful to understand economic and financial problems. They are likely to help understand what exactly went wrong with the financial system which lead to the present "subprime crisis" and many large banks and financial institutions worldwide in great jeopardy. It will require an analysis of the financial links (i.e. chains of liabilities) between these players, and how the resulting system became highly unstable. So far the Fed and the ECB injected, since the Summer of 2007, large amounts of liquidities (of the order of one trillion dollars, purely created in their books) into the system to prevent firms in difficulty (Bear Stearns, Northern Rock, Société Générale, Citicorp, Deutsche Bank, etc.) from toppling, like dominos, other firms which have in their assets liabilities with those. This injection of liquidities is reminiscent of putting grease into a lock, that is rusty and no longer functions, to unblock it, but this mechanistic simile fails to capture all the subtle workings of a monetary and financial system.
What is a "hedge fund" anyway? It could be said that a hedge fund, forgetting the word "hedge" in front, is simply a raw mutual fund, private, very lightly regulated, opened to the very rich only, and practicing the harshest, freest, most aggressive type of capitalism. They are often defined by the following characteristics (from Philip Coggan, "Guide to Hedge Funds", The Economist Press, 2008, pp3-4):
It is important to notice that characteristic number 2 (which presumably says that investors cannot get out quickly by selling their shares in the fund) is meaningless: indeed, the very nature of financial contracts is that anyone, say A, holding some shares in a fund, can always enter, at date t, into a contract with B, whereby B will become owner of A's shares as soon as the fund permits, and will benefit from all the attached perks, from t on. This is absolutely equivalent to becoming owner at date t. Therefore, the fund cannot be illiquid.
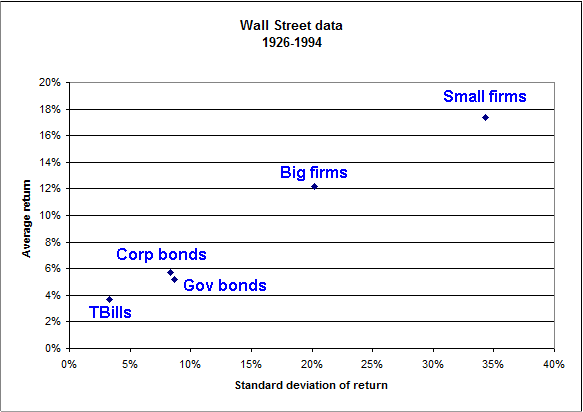
Risk and return of various securities Generally speaking, shares of equity are more risky than bonds. And because investors ask more average return from riskier securities, they are usually more profitable (on average). These general results, formalized in the Capital Asset Pricing Model (CAPM), where, within a proper set of assumptions, they can be "proved", are reasonably well substantiated by Wall Street data. Here are figures concerning five types of portfolios, over the period 1926-1994: Average rate of return and standard deviation of return of five types of portfolios:
Source: Ibbotson Associates Notes:
The graphical representation is this:
Relationship between risk (std dev of return) and average return of securities By "big firms", we mean "shares of stock of large corporations".
The general formula of the CAPM (a model where, among other hypotheses, TB have no randomness) are:
where "x" stands for "multiplied by"; TB are Treasury bills; M is "the market portfolio"; S the security under study; βS is the "beta of S", i.e. the reactivity of S compared to the market; and εS the extra randomness specific of S which can be "averaged out". Equation 1 is called the security market line. Its usual representation looks like the above picture, with all the points shifted to the left so that the risk of TB is zero. The abscissa is indifferently the standard deviation of securities (with their specific variance removed or "averaged out") or their β, knowing that the fundamental standard deviation of a security (the one that cannot be "averaged out") and its β are linked by σS = βS x σM The central teaching of the CAPM goes like this: don't bother to analyse in great detail all the securities in the market, just choose the level of risk and (therefore) of return you like, and invest in a portfolio of securities with such characteristics. Explanations and details are given here : https://www.lapasserelle.com/escem/finance1/13_portfolios_(3)/2004_finance_13b.htm. But, as we said in lesson 1, the CAPM, aside from being a nice conceptual framework to grasp the role of risk in finance, is of limited interest to understand the stock and bond markets.
The view of investors and the view of borrowers We just said that for investors shares are usually more risky than bonds. For borrowers, it is exactly the other way around: it is riskier to issue bonds than to issue shares, because bonds entail contractual payments, which is not the case of shares. And if a firm, at some date, cannot meet its coupon payment it is technically in bankruptcy.
| |||||||||||||||||||||||||||||||||||||||||||||||||||||||||||||||||||||||||||||||||||||||||||||||||||||||||||||||||||||||||||||||||||||||||||||||||||||||||||||||||||||||||||||||||||||||||||||||||||||||||||||||||||||||||||||||||||||||
